
As reservoir targets become smaller and more difficult to identify, an accurate understanding of the geological age of the strata in a region is critical for creating plausible subsurface models and maturing reservoir targets. An accurate understanding of the geological age of the strata in a region helps to create plausible subsurface models and identifying reservoir targets. Biostratigraphic data is an important data type that can provide geological age and helps to constrain the basin history and timing of the source, reservoir, seal, and trap formation. When biostratigraphic data is used in subsurface interpretation, it can offer insight into the correlation of beds that is not apparent in other data such as log curves and lithology. This information can be valuable when building a subsurface model and can make the difference between identifying a successful hydrocarbon bearing reservoir.
Biostratigraphic data isn’t always included in subsurface interpretation because the data:
The Geosciences Suite, a DecisionSpace® 365 solution, helps the geoscientist to make full use of the biostratigraphic data that is first analysed and interpreted in StrataBugs, a specialist biostratigraphic interpretation application. The Biozones, Chronostratigraphy, and Samples from StrataBugs can be quickly and easily displayed with the correct colours and line styles in Correlation, Map and Section editors in the Geosciences Suite solution. The Samples identify the depth at which fossil evidence was found and the Biozones and Chronostratigraphy capture the biostratigrapher’s interpretation of the fossil species and ages in a format that is easily understood by geologists. The Biozones can condense multiple Bioevents, which mark significant changes of fossil species in well samples, into standardised zones. Biozones can be correlated across multiple wells with other data objects such as: log curves, lithology, and dip data. This display of biostratigraphic data facilitates cross-discipline collaboration between biostratigraphers and geologists, in addition to providing more data to constrain geological interpretation. With the forthcoming new StrataBugs 3.0 release, the data in the StrataBugs database can be directly viewed and used within the Geosciences Suite solution without needing to be exported or transferred into OpenWorks® software.
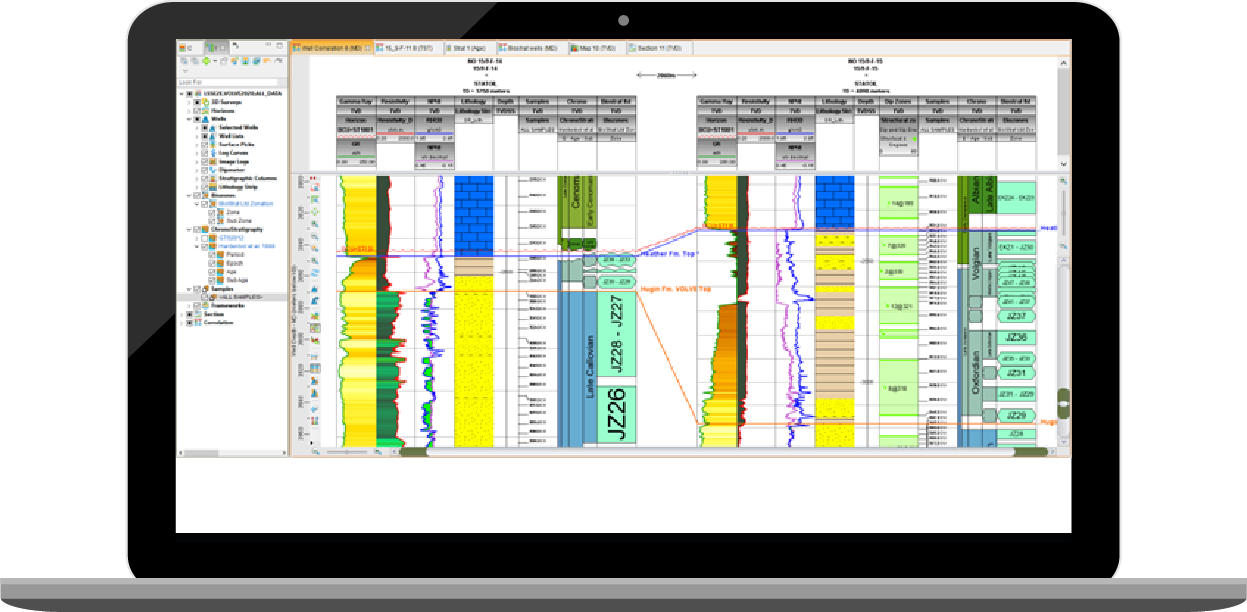 Fig. 1: Biostratigraphic data displayed in two wells within the Correlation editor in the Geosciences Suite solution. The samples, biozones, and chronostratigraphy data from StrataBugs is displayed in the three tracks on the right. Example uses the Volve dataset, provided by Equinor and the former Volve License partners.
Using Biostratigraphic Data to QC Geological Structures
The “Age Gap Analysis” (AGA) tool allows the geological age to be extracted from the biostratigraphic data to determine the age of the strata that subcrop and supracrop at a geological boundary, such as a horizon or a surface. This data is presented within a table and includes a quick select option to create surface grids from the data, such as an attribute map of the subcrop and supracrop age. These attribute maps are extremely valuable for identifying anomalies in the geological ages, which could be due to an incorrect interpretation of a horizon or well top. The AGA tool also calculates the difference in age between the subcrop and supracrop ages and creates a map of the age gap found at that geological boundary. This helps to identify age transgressive features such as unconformities or onlap surfaces. Various other values are extracted automatically calculated from the biostratigraphic data and displayed in the AGA table such as the biozone boundary confidence and isochore between the boundary and the biozone, which help analyze the confidence of the ages of the subcrop and supracrop strata.
The AGA tool helps allow a rapid and iterative workflow to create geological age maps and QC the ages of surfaces within a structural model and help make any improvements to the model that are needed. This ensures that the biostratigraphic data can be easily used within the geological interpretation workflow.
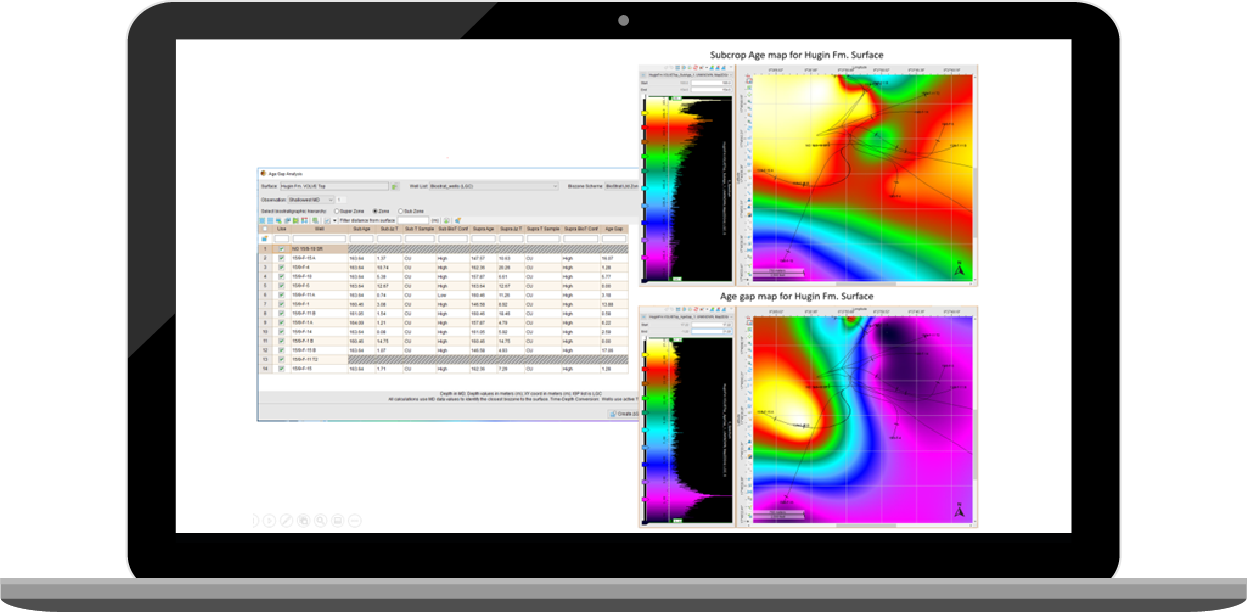 Fig. 2: “Age Gap Analysis” tool (left) and two maps produced from the tool (right). The Subcrop Age map for the Hugin Fm. Surface shows a large anomaly at one well in the South-West of the map, with a much older age than the rest of the surface. This suggests that the Hugin Fm. Surface may be interpreted at an incorrect depth within the well. The Age gap map for the Hugin Fm. Surface shows no age difference except in the North-West which indicates possible erosion in the West of the area. Example uses the Volve dataset, provided by Equinor and the former Volve License partners.
The new data transfer from the StrataBugs database to the DecisionSpace 365 Geosciences Suite helps remove the chance of user errors if the data were to be transferred manually. Integrating the data in an easily digestible format means that the geoscientist isn’t required to have specialist biostratigraphic knowledge and the biostratigraphic data can facilitate well correlation. When the display of biostratigraphic data is combined with the AGA tool geologists have the ability to visualize the age of the surfaces, QC interpretations and improve subsurface structural models, which are useful for identifying successful reservoir targets. Get in touch with our experts to more about how to identify reservoirs effectively with biostratigraphic data.
The data in the images is from the Volve field provided by Equinor and the former Volve Licence partners through Equinor’s Open Data Licence. www.equinor.com/energy/volve-data-sharing
Terms and conditions can be found here
